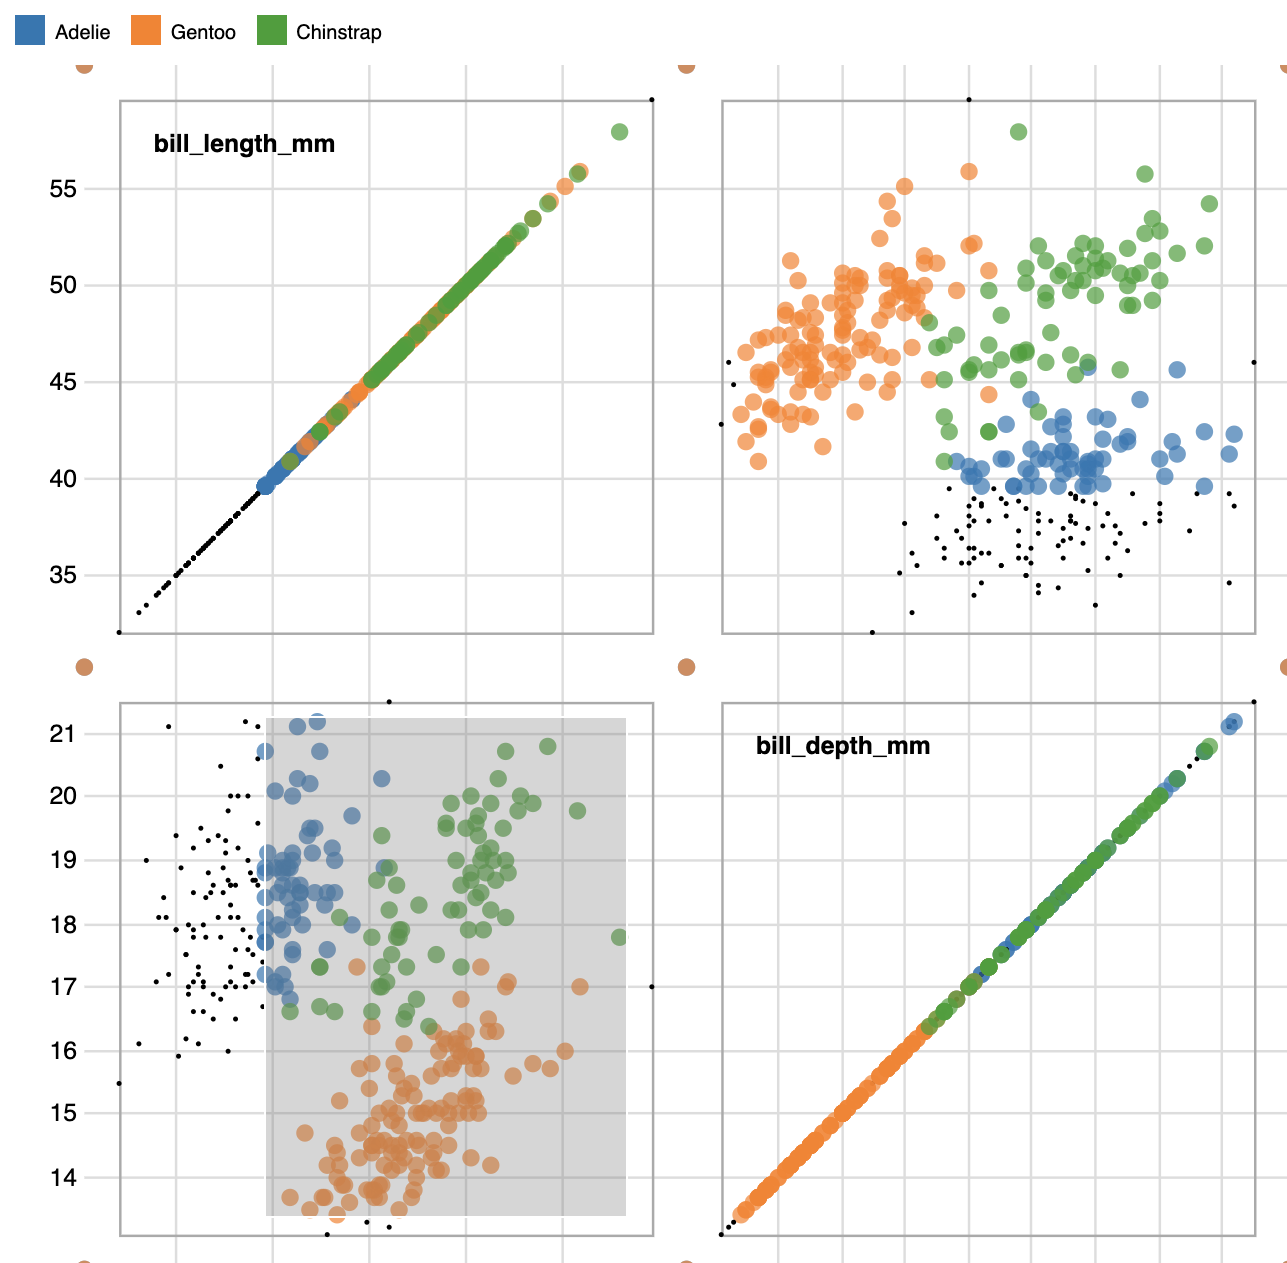
Brushable ScatterPlot Matrix
The brushable scatter plot matrix is a great way of visualy displaying corilations between various features in a dataset.
Set Up
Before Starting make sure to have Observable-Jupyter and any other needed libraries installed in your local environment.
[23]:
from observable_jupyter import embed
import pandas as pd
import json
from palmerpenguins import load_penguins
Load and Format Data
[24]:
pengunins_data = load_penguins()
pengunins_data.head()
[24]:
| species | island | bill_length_mm | bill_depth_mm | flipper_length_mm | body_mass_g | sex | year | |
|---|---|---|---|---|---|---|---|---|
| 0 | Adelie | Torgersen | 39.1 | 18.7 | 181.0 | 3750.0 | male | 2007 |
| 1 | Adelie | Torgersen | 39.5 | 17.4 | 186.0 | 3800.0 | female | 2007 |
| 2 | Adelie | Torgersen | 40.3 | 18.0 | 195.0 | 3250.0 | female | 2007 |
| 3 | Adelie | Torgersen | NaN | NaN | NaN | NaN | NaN | 2007 |
| 4 | Adelie | Torgersen | 36.7 | 19.3 | 193.0 | 3450.0 | female | 2007 |
The following block of structures code the data into a format accepted by Observable.
[25]:
result = pengunins_data.to_json(orient="records")
parsed = json.loads(result)
data = json.dumps(parsed, indent=4)
Formated_Data = json.loads(data)
Embed your data into the visualization
The Brushable ScatterPlot Matrix is made up of two cells:
key : acts as a legend for the scatterplot matrix.
viewof selection : contains the brushable scatterplot
To populate the visualization you will need to access the input variables.
data : set data equal to your formated data.
classifier : set equal to a column name that distinguishes data points. eg. species, countries, size…
columns : set equal to a list of strings where each string the name of a column you want in the scatterplot matrix.
width : default is set to 1500, however as you add more columns you will want to increase width to maintian quality.
[26]:
embed("@rstorni/brushable-scatterplot-matrix-demo",
      cells = ["viewof selection", "key"],
      inputs = {
          "data" : Formated_Data,
          "classifier" : "species",
          "columns" : ["bill_length_mm", "bill_depth_mm", "flipper_length_mm", "body_mass_g"],
          "width" : 1000
      }
     )