Pixel Value and Intensity Histogram
The Pixel Value and Intensity Histogram is useful in visualy understanding the intensity of the RGB pixel values in an image.
Set Up
Before Starting make sure to have Observable-Jupyter and any other needed libraries installed in your local environment.
[201]:
from sklearn.datasets import load_sample_images
from observable_jupyter import embed
from PIL import Image
import pandas as pd
import numpy as np
Load and Format Image Data
[202]:
images = load_sample_images()
first_image = images.images[1]
The visualization requires the pixel data to be formated as an RGBA.
[203]:
new_image = Image.fromarray(first_image).convert('RGBA')
Extract Pixel Data
[204]:
image_width = new_image.size[0]
image_height = new_image.size[1]
[205]:
pix_val = list(new_image.getdata())
pix_array = np.array(pix_val).flatten().tolist()
Embed your data into the visualization
The Summary Table visualization consists of one cell:
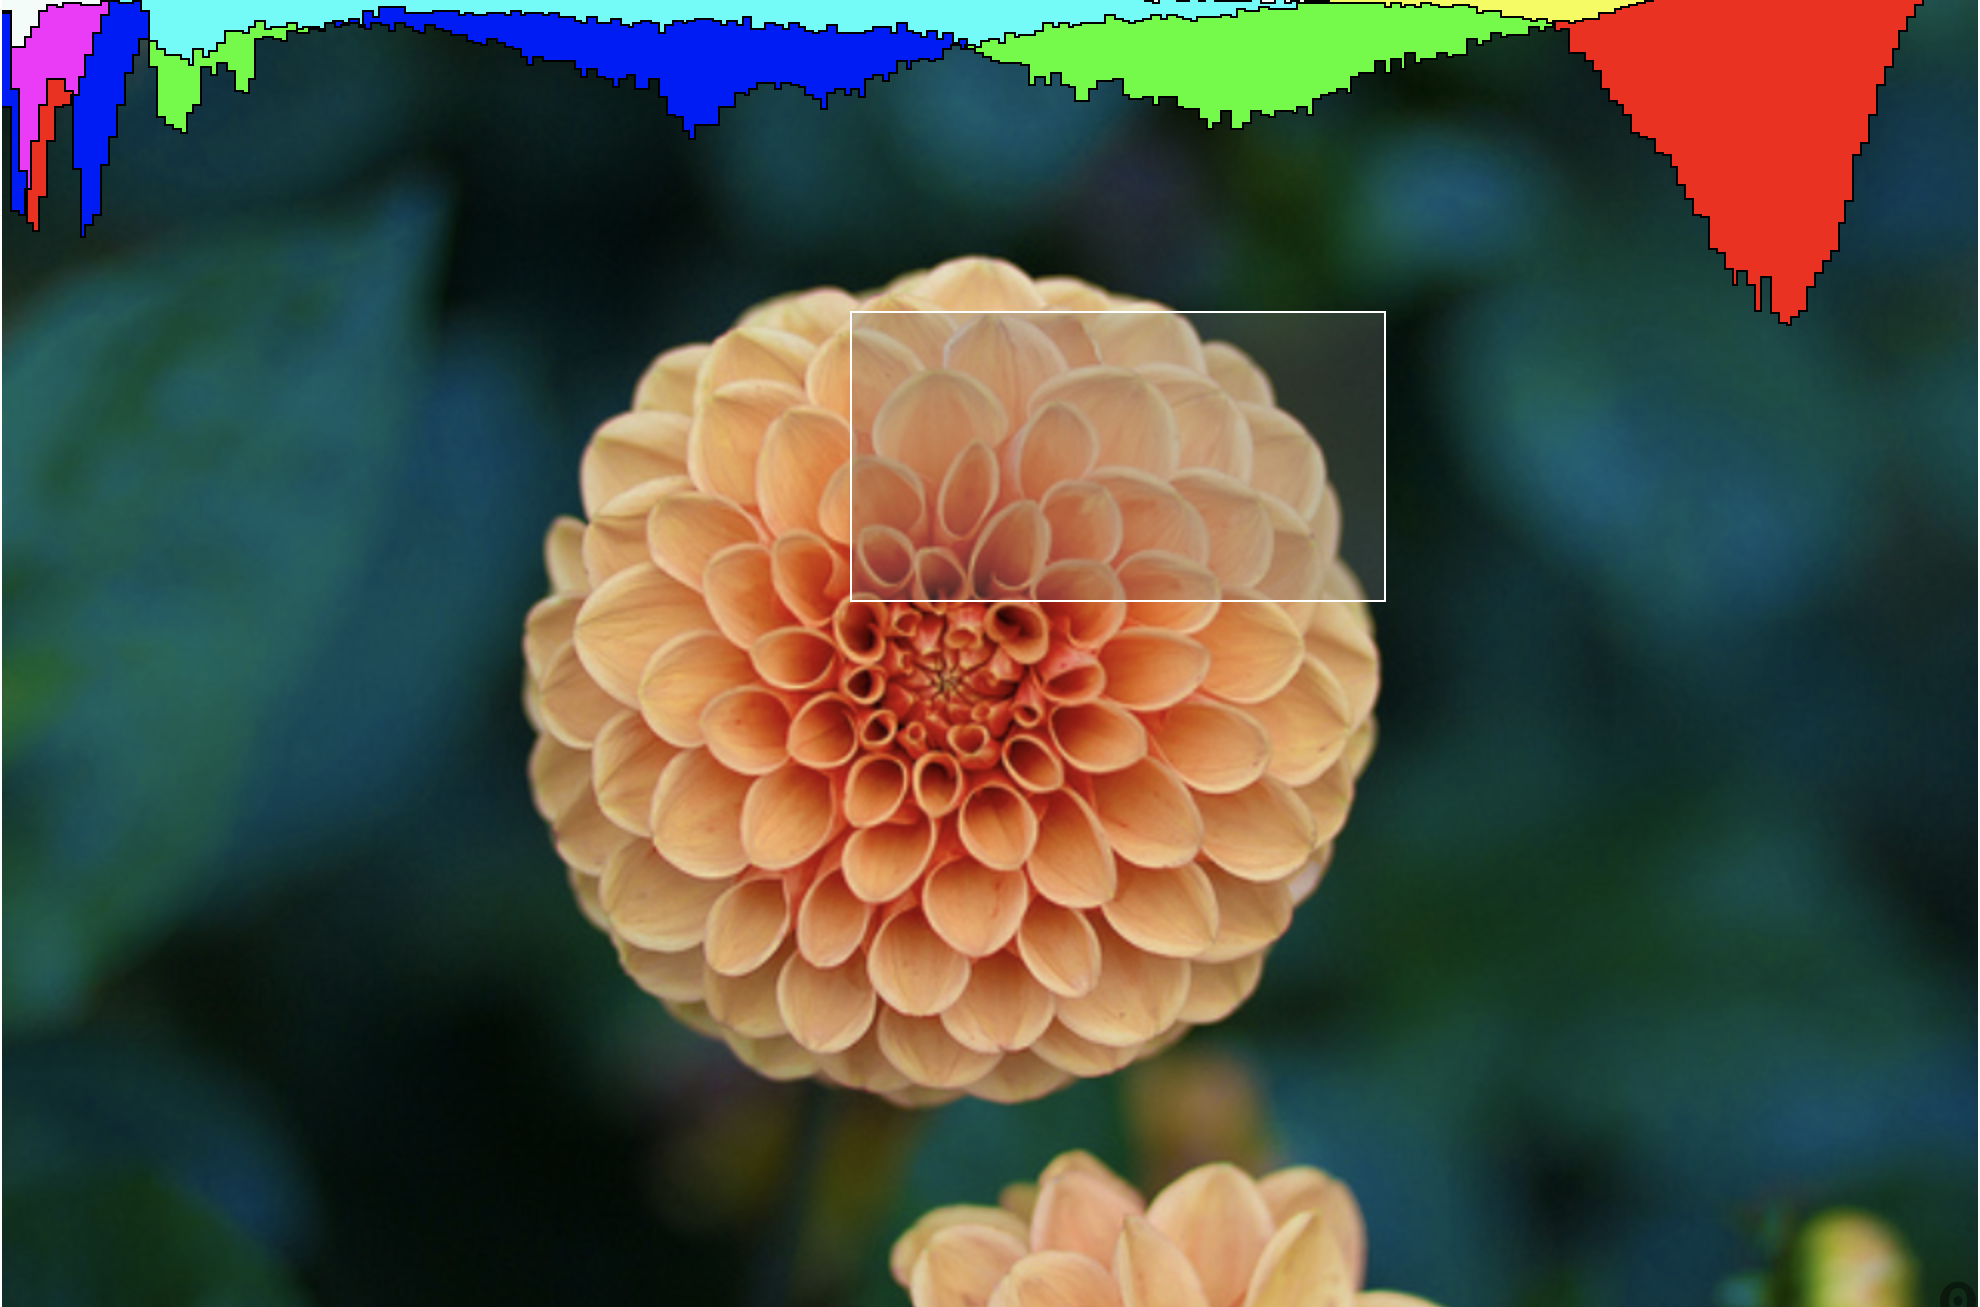
chart : Depicts the the chosen image along with a box selector and a color coded histogram at the top of the image.
To make your visualization work you will need to access the input variables.
Image_Data_Array : Set equal to a list containing pixel values of an image in a RGBA format. (should be in the same format as pix_array in the previous code block)
pix_width : Set equal to the width of the image in pixels
pix_height : Set equal to the height of the image in pixels
[206]:
embed(
    "@rstorni/image-histogram-demo",
    cells = ["chart"],
    inputs = {
        "Image_Data_Array" : pix_array,
        "pix_width" : image_width,
        "pix_height" : image_height,
    }
)